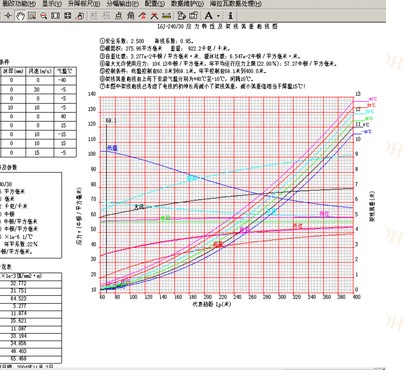
Cement Pole Load Capacity Chart
This chart illustrates the load capacity and stress analysis of a cement pole under various temperature conditions. It specifies key parameters such as safety factors, material properties, and allowable stress levels.
Technical Specifications
Product Overview
High-Precision Cement Pole Engineering Data
This comprehensive load capacity and stress analysis chart is designed for the 16J-240/30 cement pole, providing essential technical data for structural integrity and safety. It details critical performance metrics including safety factors, resistance coefficients, and stress-to-displacement relationships under varying temperature conditions. This data is vital for engineers and utility planners to ensure reliable infrastructure performance in diverse environmental settings.
Core Technical Metrics
Key Performance Metrics
2.5
Safety Factor
0.95
Resistance Coefficient
104.13 N/mm²
Max Allowable Stress
Physical Properties
- Cross-Sectional Area
- 215.96 mm²
- Unit Weight
- 922.2 kg/km
Material Composition
Material Stress Ratios
- White Cement Ratio: 3.277e-2 N/mm²
- Ash Ratio: 6.547e-2 N/mm²
Operational Conditions
- Average Operating Stress
- 57.27 N/mm² (122.00% of standard)
Environmental Specifications
- Control Conditions
- Low-Temperature ControlInitial Electrical Stress ConsideredAnnual Avg Temp 1400.0°C
- Operating Temperature Range
- 0°C to -10°C
Stress Analysis
Stress vs. Displacement Analysis
| Temperature Curve | Condition |
|---|---|
| 13°C | Active Stress Curve |
| 12°C | Active Stress Curve |
| 11°C | Active Stress Curve |
| 10°C | Active Stress Curve |